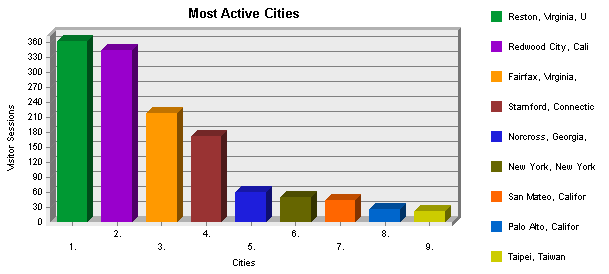
Visitors by Number of Visits During Report Period Help
This section shows the distribution of visitors based on how many times each visitor visited your site.

Visitors by Number of Visits During Report Period
Number of Visits
Number of Visitors
% of Total Unique Visitors
 1 visit 8756 93.8%
 2 visits 396 4.24%
 3 visits 76 0.81%
 4 visits 45 0.48%
 5 visits 15 0.16%
 6 visits 14 0.14%
 7 visits 3 0.03%
 8 visits 7 0.07%
 9 visits 1 0.01%
10 or more visits  21  0.22%

Visitors by Number of Visits During Report Period - Help Card Start of Chapter

 This section shows the distribution of visitors based on how many times each visitor visited your site. This covers visits made during the reporting period only; a visitor's visits before or after the reporting period do not contribute to the visitor's visit count.

 This statistic is an indication of whether or not your site compels return visits. Updating web site content is one way to improve this statistic.

 New vs. Returning Visitors Help
This section shows the number of first-time visitors to your site and the number of returning visitors to your site. Only visitors identified by cookies are counted. First-time visitors are those who didn't have a cookie on their 1st hit, but had one on later hits. Returning visitors are those who already had a cookie on their 1st hit (their previous visit happened before the start of this report period.)

New vs. Returning Visitors
New or Returning Visitor
Number of Visitor Sessions
% of Total Sessions
Unknown 10,520 99.94%
Returning Users 6 0.06%

New vs. Returning Visitors - Help Card Start of Chapter

 This section shows the number of first-time visitors to your site and the number of returning visitors to your site. Only visitors who can be identified with cookies are counted. First-time visitors are those who didn't have a cookie on their 1st hits, but had one on later hits. Returning visitors are those who already had a cookie on their 1st hit, and whose previous visit happened before the start of this report period. To get the most accurate information, make sure you set up the Cookies tab in the Options window to properly interpret the cookies you give to visitors.

 By considering the ratio between new and returning visitors over a period of time, you can determine if your site is adequately attracting repeat visits. If you consistently have a high number of returning visitors, congratulations; you're doing a good job! However, if you are accustomed to seeing a low number of returning visitors, it's time to figure out why.

 Top Authenticated Visitors Help
This section identifies the true name and relative activity level of the visitors logging onto a server that requires user name and password. You may find more authenticated visitors than visitors (in the following table) as several persons may be using the same IP address. Since many ISPs dynamically assign IP addresses, and since multiple visitors may come from a single IP address, authentication is a much more accurate way to identify top visitors.

Top Authenticated Visitors
 
Visitor
Hits
% of Total Hits
Visitor Sessions
1
valis 55 100% 5
Total 55 100% 5

Top Authenticated Visitors - Help Card Start of Chapter

 This section shows the authenticated users who visited your site the most.

 You may use this information for your marketing efforts, such as special promotions or newsletters.

 Top Visitors Help
This section identifies the IP address and/or domain name and their relative activity level on the site. If you do not use WebTrends cookies to track sessions on the site, WebTrends cannot differentiate between hits from different visitors of a same IP.

Top Visitors
 
Visitor
Hits
% of Total Hits
Visitor Sessions
1
64.86.16.2 48 0.21% 28
2
211.216.216.38 164 0.73% 28
3
crawl3-public.alexa.com 122 0.54% 22
4
crawl2-public.alexa.com 131 0.58% 22
5
crawl4-public.alexa.com 94 0.41% 21
6
marvin.northernlight.com 87 0.38% 21
7
crawler9.bos2.fast-search.net 18 0.08% 17
8
209.247.40.108 63 0.28% 16
9
cache-mtc-ah01.proxy.aol.com 14 0.06% 14
10
64.12.96.199 16 0.07% 14
11
205.188.209.200 15 0.06% 13
12
apnc110.216.216.211.in-addr.arpa 33 0.14% 13
13
cache-df02.proxy.aol.com 13 0.05% 12
14
ezspider006.directhit.com 42 0.18% 12
15
152.163.188.2 12 0.05% 11
16
205.188.209.102 13 0.05% 11
17
crawl1.googlebot.com 15 0.06% 10
18
152.163.188.227 11 0.04% 10
19
crawl4.googlebot.com 14 0.06% 10
20
ezspider005.directhit.com 29 0.12% 10
Subtotal for Visitors Above 954 4.25% 315
Total 22,415 100% 10,526

Top Visitors - Help Card Start of Chapter

 This section identifies IP addresses and/or domain names of visitors and their relative activity level. If you use WebTrends cookies to track sessions on the site, WebTrends can differentiate hits from visitors with the same IP address.
Tip: Consider the Visitor Address Filter to include or exclude activity based on visitor IP or domain.

 Consider the visitors who use the site most, and tailor your site to their interests and needs. If this is an intranet, notice which employees use the site the most and find out what they like about it. You might also get feedback from those who use it the least and find out what they are looking for.

 Top Geographic Regions Help
This section identifies the top locations of the visitors to the site by geographic region. The geographic region of the visitor is determined by the suffix of their domain name. Use this information carefully because this information is based on where the domain name of the visitor is registered, and may not always be an accurate identifier of the actual geographic location of this visitor. For example, while a vast majority of .com domain names are from North America, there is a small minority of domain names that exist outside of North America.

Top Geographic Regions
 
Geographic Regions
Visitor Sessions
1
Region Un-Specified 4,798
2
North America 4,239
3
Western Europe 786
4
Asia 236
5
Northern Europe 119
6
Eastern Europe 104
7
Australia 76
8
Middle East 67
9
South America 29
10
Pacific Islands 22
11
Sub-Saharan Africa 20
12
Region Not Known 18
13
Caribbean Islands 11
14
Central America 1
Total 10,526

Top Geographic Regions - Help Card Start of Chapter

 This section identifies the top locations of the visitors to the site by geographic region. The geographic region is determined by the suffix of their domain names. Use this information carefully because it is based on where the domain name of the visitor is registered, and may not always be an accurate identifier of the visitor's actual geographic location. For example, while a vast majority of .com domain names are from North America, there is a small minority that exist outside of North America.
If reverse DNS lookups have not been performed, WebTrends cannot determine the country of origin and this section is not included in the report. The table lists the top geographic regions in decreasing order of the number of hits.
Tip: Consider the Visitor Address Filter to include or exclude activity based on visitor country.

 This information can help you meet the needs of your target audience as well as discover new audiences. Consider how you can make the content comprehensive and relevant to an International audience.

 Most Active Countries Help
This section identifies the top locations of the visitors to the site by country. The country of the visitor is determined by the suffix of their domain name. Use this information carefully because this information is based on where the domain name of the visitor is registered, and may not always be an accurate identifier of the actual geographic location of this visitor. For example, while a vast majority of .com domain names are from the United States, there is a small minority of domain names that exist outside of the United States.

Most Active Countries
 
Countries
Visitor Sessions
1
United States 3,935
2
Canada 256
3
Netherlands 199
4
France 133
5
Japan 120
6
UK 97
7
Italy 82
8
AU 76
9
Germany 70
10
Belgium 56
11
Sweden 50
12
Spain 50
13
Mexico 48
14
Austria 38
15
Taiwan 38
16
Russian Federation 33
17
Saudi Arabia 32
18
Denmark 32
19
Finland 25
20
Greece 24
Total 5,394

Most Active Countries - Help Card Start of Chapter

 This section identifies the top locations of the visitors to the site by country. The country is determined by the suffix of their domain names. Use this information carefully because it is based on where the domain name of the visitor is registered, and may not always be an accurate identifier of the visitor's actual geographic location. For example, while a vast majority of .com domain names are from the United States, there is a small minority that exist outside of the United States.
If reverse DNS lookups have not been performed, WebTrends cannot determine the country of origin and this section is not included in the report. The table lists the top countries in decreasing order of the number of hits.
Tip: Consider the Visitor Address Filter to include or exclude activity based on visitor country.

 This information can help you meet the needs of your target audience as well as discover new audiences. Consider how you can make the content comprehensive and relevant to an International audience.

 North American States and Provinces Help
This section breaks down web site activity to show which of the North American States and Provinces were the most active on the site. This information is based on where the domain name of the visitor is registered, and may not always be an accurate representation of the actual geographic location of this visitor. This information can only be displayed if reverse DNS lookups have been performed.

North American States & Provinces
 
State
Visitor Sessions
1
Virginia 587
2
California 531
3
Connecticut 189
4
New York 74
5
Georgia 69
6
Texas 46
7
Illinois 37
8
New Jersey 36
9
Ontario 36
10
Massachusetts 33
11
Pennsylvania 33
12
North Carolina 29
13
Washington 25
14
Florida 17
15
Missouri 16
16
Ohio 16
17
Indiana 14
18
Colorado 13
19
Oregon 12
20
Michigan 12
Total For the States Above 1,825

North American States and Provinces - Help Card Start of Chapter

 This section shows which of the North American States and Provinces were the most active on the site. This information is based on where the domain name of the visitor is registered, and may not always be an accurate representation of the actual geographic location of this visitor (for example, individual visitors will often be seen as coming from the state where their ISPs are registered.) This information can only be displayed if reverse DNS lookups have been performed.

 This information can help you cater to your audience. Expand your audience by addressing the needs of those you want to draw to the site.

 Most Active Cities Help
This section further breaks down the site's activity to show which cities were the most active on the site. This information is based on where the domain name of the visitor is registered, and may not always be an accurate representation of the actual geographic location of this visitor. This information can only be displayed if reverse DNS lookups have been performed.

Most Active Cities
 
City, State
Visitor Sessions
1
Reston, Virginia, United States 361
2
Redwood City, California, United States 344
3
Fairfax, Virginia, United States 217
4
Stamford, Connecticut, United States 173
5
Norcross, Georgia, United States 61
6
New York, New York, United States 51
7
San Mateo, California, United States 45
8
Palo Alto, California, United States 27
9
Taipei, Taiwan 23
10
Cambridge, Massachusetts, United States 21
11
Princeton, New Jersey, United States 17
12
Pasadena, California, United States 16
13
Coudersport, Pennsylvania, United States 13
14
Hong Kong, Hong Kong 12
15
Burlington, Ontario, Canada 11
16
Redmond, Washington, United States 11
17
Dallas, Texas, United States 10
18
Hoffman Estates, Illinois, United States 9
19
Ottawa, Ontario, Canada 9
20
Raleigh, North Carolina, United States 9
Total For the Cities Above 1,440

Most Active Cities - Help Card Start of Chapter

 This section breaks down activity further to show which cities were the most active. This information is based on where the visitor's domain name is registered, and may not necessarily be an accurate representation of the visitor's actual geographic location. For example, visitors are frequently shown as coming from the city where their ISPs are registered.) This information can only be provided if reverse DNS lookups have been performed.

 City information can be useful in focusing your marketing efforts in other media such as print or television advertising.

 Most Active Organizations Help
This section identifies the companies or organizations that accessed the site the most often.

Most Active Organizations
 
Organizations
Hits
% of Total Hits
Visitor Sessions
1
Home Network
http://home.com
337 1.5% 337
2
America Online
http://aol.com
310 1.38% 310
3
UUNET Technologies Inc.
http://uu.net
217 0.96% 217
4
EXCALIBUR Group A Time Warner Company
http://rr.com
171 0.76% 171
5
http://t-dialin.net 130 0.57% 82
6
http://bellsouth.net 218 0.97% 80
7
http://shawcable.net 125 0.55% 75
8
http://alexa.com 367 1.63% 71
9
Media 1
http://mediaone.net
60 0.26% 60
10
http://abo.wanadoo.fr 68 0.3% 57
11
http://Level3.net 107 0.47% 48
12
Inktomi Corp.
http://inktomi.com
43 0.19% 43
13
http://pacbell.net 165 0.73% 42
14
MindSpring Enterprises Inc.
http://mindspring.com
113 0.5% 42
15
http://googlebot.com 58 0.25% 38
16
http://btinternet.com 81 0.36% 36
17
http://uswest.net 125 0.55% 36
18
http://psi.net 56 0.24% 35
19
http://inktomisearch.com 50 0.22% 35
20
PP List Management Inc.
http://directhit.com
32 0.14% 32
Subtotal For Companies Above 2,833 12.63% 1,847
Total For the Log File 22,415 100% 10,526

Most Active Organizations - Help Card Start of Chapter

 This section identifies the companies or organizations that accessed the site the most often. If the DNS lookup option is set to "Always" or "Automatically," WebTrends searches for the domain name in the company database, and includes the company name and geographic information in the graph and table. If reverse DNS lookups are not performed, either by WebTrends or by the server, only IP addresses are listed. The table lists companies and organizations in decreasing order of the number of hits.

 Determine how your e-business can be improved according to how businesses are using your site. Consider how your product can be made more attractive to organizations that have shown interest.

 Organization Breakdown Help
This section provides a breakdown by types of organizations (.com, .net, .edu, .org, .mil, and .gov.) This information can only be displayed if reverse DNS lookups have been performed, and the percentages refer to the total of hits for which the organization type can be determined (some IPs cannot be resolved to a domain, and therefore an organization type cannot be determined).

Organization Breakdown
 
Organization Type
Hits
% of Total Hits
Visitor Sessions
1
Commercial 4,542 47.78% 2,089
2
Network 4,234 44.54% 1,938
3
Education 421 4.42% 185
4
Organization 139 1.46% 55
5
Military 71 0.74% 38
6
Government 56 0.58% 27
7
Arpanet 43 0.45% 21
Total for Known Organization Types 9,506 100% 4,353

Organization Breakdown - Help Card Start of Chapter

 This section provides a breakdown by types of organizations (.com, .net, .edu, .org, .mil, and .gov.) The table lists the types of organizations in decreasing order of the number of hits. This information can only be provided if reverse DNS lookups have been performed, and the percentages refer to the total of hits for which the organization type can be determined (some IPs cannot be resolved to a domain, and therefore an organization type cannot be determined).

 Consider what type of organization is interested in your site and how you can attract other types.

[WebTrends Corporation]

This report was generated by WebTrends.


WebTrends is a registered trademark of WebTrends Corporation.  
Other trademarks are the property of their respective owners.