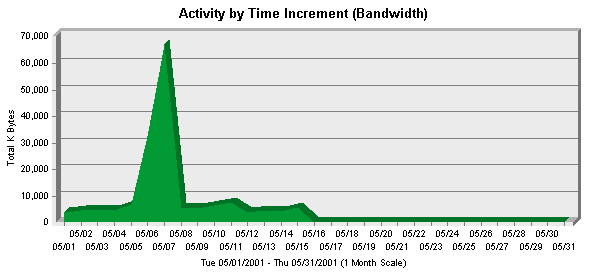
| Summary of Activity by Time Increment |
|
|
|
Time Interval
|
Hits
|
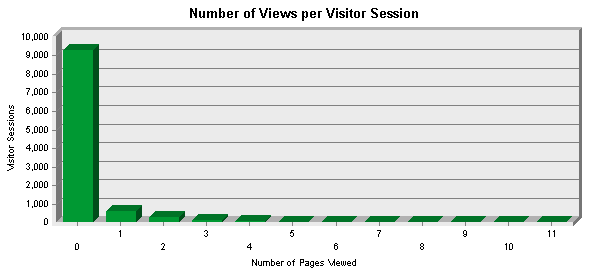
Page Views
|
KBytes Transferred
|
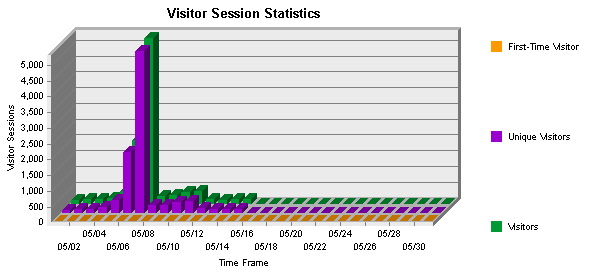
Visitor Sessions
|
|
Tue 05/01/2001 |
883 |
222 |
3,912 K |
139 |
|
Wed 05/02/2001 |
814 |
309 |
4,838 K |
179 |
|
Thu 05/03/2001 |
911 |
233 |
4,592 K |
160 |
|
Fri 05/04/2001 |
803 |
189 |
4,866 K |
216 |
|
Sat 05/05/2001 |
941 |
189 |
6,943 K |
441 |
|
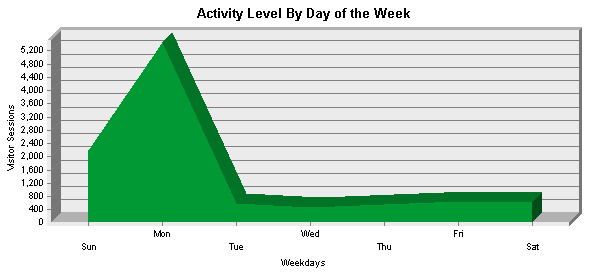
Sun 05/06/2001 |
3,182 |
690 |
32,431 K |
2,035 |
|
Mon 05/07/2001 |
6,141 |
177 |
67,072 K |
5,290 |
|
Tue 05/08/2001 |
1,087 |
224 |
5,676 K |
282 |
|
Wed 05/09/2001 |
977 |
245 |
5,641 K |
293 |
|
Thu 05/10/2001 |
1,136 |
169 |
6,458 K |
387 |
|
Fri 05/11/2001 |
1,354 |
161 |
7,578 K |
433 |
|
Sat 05/12/2001 |
773 |
159 |
4,066 K |
186 |
|
Sun 05/13/2001 |
850 |
309 |
4,891 K |
155 |
|
Mon 05/14/2001 |
983 |
212 |
4,337 K |
164 |
|
Tue 05/15/2001 |
1,576 |
359 |
5,646 K |
163 |
|
Wed 05/16/2001 |
4 |
4 |
43 K |
3 |
|
Total
|
22,415
|
3,851
|
168,990 K
|
10,526
|
|