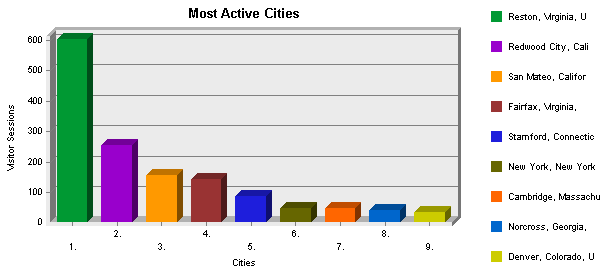
Visitors by Number of Visits During Report Period Help
This section shows the distribution of visitors based on how many times each visitor visited your site.

Visitors by Number of Visits During Report Period
Number of Visits
Number of Visitors
% of Total Unique Visitors
 1 visit 4103 87.18%
 2 visits 333 7.07%
 3 visits 91 1.93%
 4 visits 52 1.1%
 5 visits 38 0.8%
 6 visits 24 0.5%
 7 visits 20 0.42%
 8 visits 5 0.1%
 9 visits 9 0.19%
10 or more visits  31  0.65%

Visitors by Number of Visits During Report Period - Help Card Start of Chapter

 This section shows the distribution of visitors based on how many times each visitor visited your site. This covers visits made during the reporting period only; a visitor's visits before or after the reporting period do not contribute to the visitor's visit count.

 This statistic is an indication of whether or not your site compels return visits. Updating web site content is one way to improve this statistic.

 New vs. Returning Visitors Help
This section shows the number of first-time visitors to your site and the number of returning visitors to your site. Only visitors identified by cookies are counted. First-time visitors are those who didn't have a cookie on their 1st hit, but had one on later hits. Returning visitors are those who already had a cookie on their 1st hit (their previous visit happened before the start of this report period.)

New vs. Returning Visitors
New or Returning Visitor
Number of Visitor Sessions
% of Total Sessions
Unknown 6,422 99.86%
Returning Users 9 0.14%

New vs. Returning Visitors - Help Card Start of Chapter

 This section shows the number of first-time visitors to your site and the number of returning visitors to your site. Only visitors who can be identified with cookies are counted. First-time visitors are those who didn't have a cookie on their 1st hits, but had one on later hits. Returning visitors are those who already had a cookie on their 1st hit, and whose previous visit happened before the start of this report period. To get the most accurate information, make sure you set up the Cookies tab in the Options window to properly interpret the cookies you give to visitors.

 By considering the ratio between new and returning visitors over a period of time, you can determine if your site is adequately attracting repeat visits. If you consistently have a high number of returning visitors, congratulations; you're doing a good job! However, if you are accustomed to seeing a low number of returning visitors, it's time to figure out why.

 Top Authenticated Visitors Help
This section identifies the true name and relative activity level of the visitors logging onto a server that requires user name and password. You may find more authenticated visitors than visitors (in the following table) as several persons may be using the same IP address. Since many ISPs dynamically assign IP addresses, and since multiple visitors may come from a single IP address, authentication is a much more accurate way to identify top visitors.

Top Authenticated Visitors
 
Visitor
Hits
% of Total Hits
Visitor Sessions
1
valis 143 100% 9
Total 143 100% 9

Top Authenticated Visitors - Help Card Start of Chapter

 This section shows the authenticated users who visited your site the most.

 You may use this information for your marketing efforts, such as special promotions or newsletters.

 Top Visitors Help
This section identifies the IP address and/or domain name and their relative activity level on the site. If you do not use WebTrends cookies to track sessions on the site, WebTrends cannot differentiate between hits from different visitors of a same IP.

Top Visitors
 
Visitor
Hits
% of Total Hits
Visitor Sessions
1
64.86.16.2 160 0.52% 86
2
crawler9.bos2.fast-search.net 71 0.23% 50
3
marvin.northernlight.com 209 0.68% 46
4
cr1002631-a.crdva1.bc.wave.home.com 927 3.04% 24
5
cache-mtc-ah01.proxy.aol.com 23 0.07% 23
6
crawl1.googlebot.com 30 0.09% 21
7
209.73.164.127 40 0.13% 20
8
202.156.0.6 166 0.54% 18
9
cache-rh03.proxy.aol.com 19 0.06% 18
10
cache-rk02.proxy.aol.com 17 0.05% 17
11
cache-da02.proxy.aol.com 17 0.05% 17
12
ch5smc.bellglobal.com 84 0.27% 16
13
cache-rr03.proxy.aol.com 15 0.04% 15
14
209.157.194.253 32 0.1% 15
15
cache-mtc-ak02.proxy.aol.com 14 0.04% 14
16
cache-dl09.proxy.aol.com 14 0.04% 14
17
ipd50a0a75.speed.planet.nl 32 0.1% 13
18
cache-ra02.proxy.aol.com 13 0.04% 13
19
216.167.107.159 16 0.05% 13
20
ezspider005.directhit.com 42 0.13% 12
Subtotal for Visitors Above 1,941 6.36% 465
Total 30,493 100% 6,431

Top Visitors - Help Card Start of Chapter

 This section identifies IP addresses and/or domain names of visitors and their relative activity level. If you use WebTrends cookies to track sessions on the site, WebTrends can differentiate hits from visitors with the same IP address.
Tip: Consider the Visitor Address Filter to include or exclude activity based on visitor IP or domain.

 Consider the visitors who use the site most, and tailor your site to their interests and needs. If this is an intranet, notice which employees use the site the most and find out what they like about it. You might also get feedback from those who use it the least and find out what they are looking for.

 Top Geographic Regions Help
This section identifies the top locations of the visitors to the site by geographic region. The geographic region of the visitor is determined by the suffix of their domain name. Use this information carefully because this information is based on where the domain name of the visitor is registered, and may not always be an accurate identifier of the actual geographic location of this visitor. For example, while a vast majority of .com domain names are from North America, there is a small minority of domain names that exist outside of North America.

Top Geographic Regions
 
Geographic Regions
Visitor Sessions
1
North America 3,470
2
Region Un-Specified 2,423
3
Western Europe 189
4
Asia 97
5
Eastern Europe 71
6
Australia 61
7
Middle East 29
8
South America 27
9
Northern Europe 25
10
Pacific Islands 16
11
Region Not Known 12
12
Caribbean Islands 5
13
Sub-Saharan Africa 5
14
North Africa 1
Total 6,431

Top Geographic Regions - Help Card Start of Chapter

 This section identifies the top locations of the visitors to the site by geographic region. The geographic region is determined by the suffix of their domain names. Use this information carefully because it is based on where the domain name of the visitor is registered, and may not always be an accurate identifier of the visitor's actual geographic location. For example, while a vast majority of .com domain names are from North America, there is a small minority that exist outside of North America.
If reverse DNS lookups have not been performed, WebTrends cannot determine the country of origin and this section is not included in the report. The table lists the top geographic regions in decreasing order of the number of hits.
Tip: Consider the Visitor Address Filter to include or exclude activity based on visitor country.

 This information can help you meet the needs of your target audience as well as discover new audiences. Consider how you can make the content comprehensive and relevant to an International audience.

 Most Active Countries Help
This section identifies the top locations of the visitors to the site by country. The country of the visitor is determined by the suffix of their domain name. Use this information carefully because this information is based on where the domain name of the visitor is registered, and may not always be an accurate identifier of the actual geographic location of this visitor. For example, while a vast majority of .com domain names are from the United States, there is a small minority of domain names that exist outside of the United States.

Most Active Countries
 
Countries
Visitor Sessions
1
United States 3,287
2
Canada 174
3
AU 61
4
UK 48
5
Russian Federation 34
6
Netherlands 32
7
Japan 28
8
Hong Kong 21
9
Belgium 20
10
Singapore 16
11
New Zealand (Aotearoa) 16
12
Saudi Arabia 15
13
France 14
14
Germany 14
15
Argentina 13
16
Switzerland 12
17
Denmark 12
18
Italy 12
19
Thailand 12
20
Malaysia 11
Total 3,852

Most Active Countries - Help Card Start of Chapter

 This section identifies the top locations of the visitors to the site by country. The country is determined by the suffix of their domain names. Use this information carefully because it is based on where the domain name of the visitor is registered, and may not always be an accurate identifier of the visitor's actual geographic location. For example, while a vast majority of .com domain names are from the United States, there is a small minority that exist outside of the United States.
If reverse DNS lookups have not been performed, WebTrends cannot determine the country of origin and this section is not included in the report. The table lists the top countries in decreasing order of the number of hits.
Tip: Consider the Visitor Address Filter to include or exclude activity based on visitor country.

 This information can help you meet the needs of your target audience as well as discover new audiences. Consider how you can make the content comprehensive and relevant to an International audience.

 North American States and Provinces Help
This section breaks down web site activity to show which of the North American States and Provinces were the most active on the site. This information is based on where the domain name of the visitor is registered, and may not always be an accurate representation of the actual geographic location of this visitor. This information can only be displayed if reverse DNS lookups have been performed.

North American States & Provinces
 
State
Visitor Sessions
1
Virginia 756
2
California 543
3
Connecticut 97
4
New York 66
5
Massachusetts 54
6
Colorado 54
7
Georgia 43
8
Ontario 40
9
North Carolina 37
10
Texas 32
11
Pennsylvania 31
12
Illinois 23
13
New Jersey 22
14
Ohio 22
15
Washington 13
16
Michigan 12
17
Wisconsin 10
18
Maryland 10
19
Arkansas 10
20
Florida 10
Total For the States Above 1,885

North American States and Provinces - Help Card Start of Chapter

 This section shows which of the North American States and Provinces were the most active on the site. This information is based on where the domain name of the visitor is registered, and may not always be an accurate representation of the actual geographic location of this visitor (for example, individual visitors will often be seen as coming from the state where their ISPs are registered.) This information can only be displayed if reverse DNS lookups have been performed.

 This information can help you cater to your audience. Expand your audience by addressing the needs of those you want to draw to the site.

 Most Active Cities Help
This section further breaks down the site's activity to show which cities were the most active on the site. This information is based on where the domain name of the visitor is registered, and may not always be an accurate representation of the actual geographic location of this visitor. This information can only be displayed if reverse DNS lookups have been performed.

Most Active Cities
 
City, State
Visitor Sessions
1
Reston, Virginia, United States 601
2
Redwood City, California, United States 254
3
San Mateo, California, United States 155
4
Fairfax, Virginia, United States 144
5
Stamford, Connecticut, United States 88
6
New York, New York, United States 46
7
Cambridge, Massachusetts, United States 46
8
Norcross, Georgia, United States 40
9
Denver, Colorado, United States 36
10
Palo Alto, California, United States 32
11
Ottawa, Ontario, Canada 24
12
Raleigh, North Carolina, United States 22
13
Sunnyvale, California, United States 19
14
Hong Kong, Hong Kong 13
15
Pasadena, California, United States 13
16
Burlington, Ontario, Canada 10
17
Little Rock, Arkansas, United States 9
18
Princeton, New Jersey, United States 9
19
Vancouver, British Columbia, Canada 8
20
San Jose, California, United States 8
Total For the Cities Above 1,577

Most Active Cities - Help Card Start of Chapter

 This section breaks down activity further to show which cities were the most active. This information is based on where the visitor's domain name is registered, and may not necessarily be an accurate representation of the visitor's actual geographic location. For example, visitors are frequently shown as coming from the city where their ISPs are registered.) This information can only be provided if reverse DNS lookups have been performed.

 City information can be useful in focusing your marketing efforts in other media such as print or television advertising.

 Most Active Organizations Help
This section identifies the companies or organizations that accessed the site the most often.

Most Active Organizations
 
Organizations
Hits
% of Total Hits
Visitor Sessions
1
America Online
http://aol.com
557 1.82% 557
2
Home Network
http://home.com
165 0.54% 165
3
Inktomi Corp.
http://inktomi.com
155 0.5% 155
4
UUNET Technologies Inc.
http://uu.net
144 0.47% 144
5
Excite Inc
http://excite.com
87 0.28% 87
6
EXCALIBUR Group A Time Warner Company
http://rr.com
87 0.28% 87
7
http://64.86.16.2 160 0.52% 86
8
http://bellsouth.net 350 1.14% 57
9
http://fast-search.net 72 0.23% 51
10
Northern Light Technology LLC
http://northernlight.com
46 0.15% 46
11
http://googlebot.com 62 0.2% 43
12
http://Level3.net 91 0.29% 40
13
Media 1
http://mediaone.net
40 0.13% 40
14
http://alexa.com 87 0.28% 37
15
Qwest Communications
http://qwest.net
36 0.11% 36
16
PP List Management Inc.
http://directhit.com
32 0.1% 32
17
http://uswest.net 197 0.64% 32
18
http://psi.net 113 0.37% 32
19
WebTV Networks Inc
http://webtv.net
29 0.09% 29
20
http://shawcable.net 163 0.53% 28
Subtotal For Companies Above 2,673 8.76% 1,784
Total For the Log File 30,493 100% 6,431

Most Active Organizations - Help Card Start of Chapter

 This section identifies the companies or organizations that accessed the site the most often. If the DNS lookup option is set to "Always" or "Automatically," WebTrends searches for the domain name in the company database, and includes the company name and geographic information in the graph and table. If reverse DNS lookups are not performed, either by WebTrends or by the server, only IP addresses are listed. The table lists companies and organizations in decreasing order of the number of hits.

 Determine how your e-business can be improved according to how businesses are using your site. Consider how your product can be made more attractive to organizations that have shown interest.

 Organization Breakdown Help
This section provides a breakdown by types of organizations (.com, .net, .edu, .org, .mil, and .gov.) This information can only be displayed if reverse DNS lookups have been performed, and the percentages refer to the total of hits for which the organization type can be determined (some IPs cannot be resolved to a domain, and therefore an organization type cannot be determined).

Organization Breakdown
 
Organization Type
Hits
% of Total Hits
Visitor Sessions
1
Commercial 7,404 52.31% 1,948
2
Network 6,005 42.43% 1,324
3
Education 437 3.08% 158
4
Organization 132 0.93% 33
5
Military 79 0.55% 28
6
Government 55 0.38% 18
7
Arpanet 40 0.28% 11
Total for Known Organization Types 14,152 100% 3,520

Organization Breakdown - Help Card Start of Chapter

 This section provides a breakdown by types of organizations (.com, .net, .edu, .org, .mil, and .gov.) The table lists the types of organizations in decreasing order of the number of hits. This information can only be provided if reverse DNS lookups have been performed, and the percentages refer to the total of hits for which the organization type can be determined (some IPs cannot be resolved to a domain, and therefore an organization type cannot be determined).

 Consider what type of organization is interested in your site and how you can attract other types.

[WebTrends Corporation]

This report was generated by WebTrends.


WebTrends is a registered trademark of WebTrends Corporation.  
Other trademarks are the property of their respective owners.