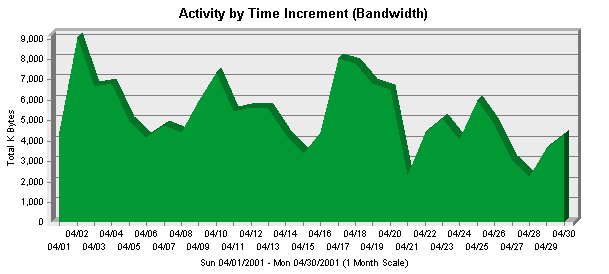
| Summary of Activity by Time Increment |
|
|
|
Time Interval
|
Hits
|
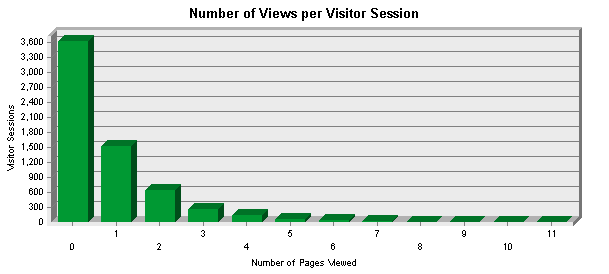
Page Views
|
KBytes Transferred
|
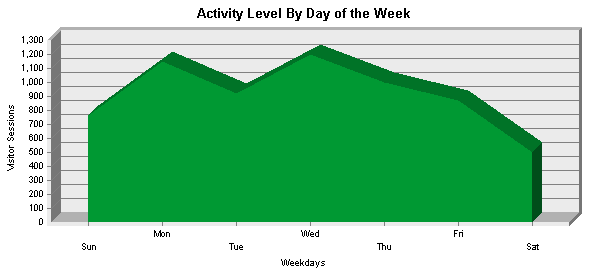
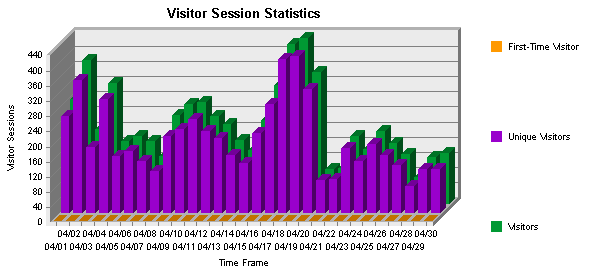
Visitor Sessions
|
|
Sun 04/01/2001 |
859 |
124 |
4,500 K |
278 |
|
Mon 04/02/2001 |
1,747 |
428 |
9,064 K |
380 |
|
Tue 04/03/2001 |
1,154 |
313 |
6,655 K |
198 |
|
Wed 04/04/2001 |
1,378 |
258 |
6,821 K |
320 |
|
Thu 04/05/2001 |
1,271 |
283 |
4,977 K |
168 |
|
Fri 04/06/2001 |
903 |
247 |
4,204 K |
180 |
|
Sat 04/07/2001 |
886 |
298 |
4,767 K |
168 |
|
Sun 04/08/2001 |
818 |
243 |
4,414 K |
128 |
|
Mon 04/09/2001 |
1,194 |
321 |
5,950 K |
236 |
|
Tue 04/10/2001 |
1,517 |
404 |
7,351 K |
264 |
|
Wed 04/11/2001 |
1,158 |
247 |
5,448 K |
269 |
|
Thu 04/12/2001 |
1,096 |
194 |
5,651 K |
232 |
|
Fri 04/13/2001 |
1,028 |
223 |
5,592 K |
213 |
|
Sat 04/14/2001 |
681 |
225 |
4,313 K |
170 |
|
Sun 04/15/2001 |
648 |
138 |
3,395 K |
143 |
|
Mon 04/16/2001 |
742 |
137 |
4,418 K |
222 |
|
Tue 04/17/2001 |
1,275 |
291 |
8,035 K |
316 |
|
Wed 04/18/2001 |
1,317 |
190 |
7,826 K |
423 |
|
Thu 04/19/2001 |
1,244 |
217 |
6,801 K |
438 |
|
Fri 04/20/2001 |
1,144 |
249 |
6,515 K |
348 |
|
Sat 04/21/2001 |
578 |
127 |
2,319 K |
94 |
|
Sun 04/22/2001 |
732 |
276 |
4,448 K |
96 |
|
Mon 04/23/2001 |
1,079 |
246 |
5,134 K |
181 |
|
Tue 04/24/2001 |
877 |
166 |
4,101 K |
147 |
|
Wed 04/25/2001 |
1,192 |
309 |
6,008 K |
193 |
|
Thu 04/26/2001 |
944 |
222 |
4,828 K |
162 |
|
Fri 04/27/2001 |
672 |
120 |
3,078 K |
132 |
|
Sat 04/28/2001 |
628 |
95 |
2,294 K |
72 |
|
Sun 04/29/2001 |
822 |
224 |
3,668 K |
124 |
|
Mon 04/30/2001 |
909 |
212 |
4,327 K |
136 |
|
Total
|
30,493
|
7,027
|
156,902 K
|
6,431
|
|