This table shows the total number of hits for the site, how many were successful, how many failed, and calculates the percentage of hits that failed. It may help you in determining the reliability of the site.
This table shows the total number of hits for the site, how many were successful, how many failed, and calculates the percentage of hits that failed. Failed hits are hits where a server or client error occurred. Cached hits are those where the page was found in the cache of the browser, so the server did not need to transfer the file.
This section is useful in determining the reliability of the site.
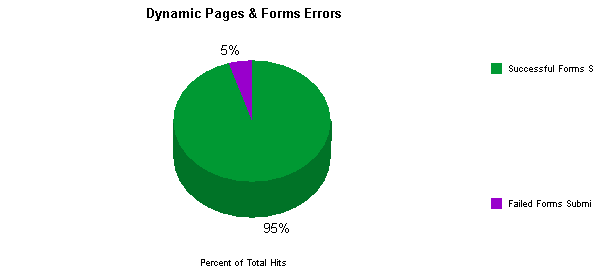
This section shows the number of successful form submissions compared to the number that failed. WebTrends considers anything with Post command as a dynamic page.
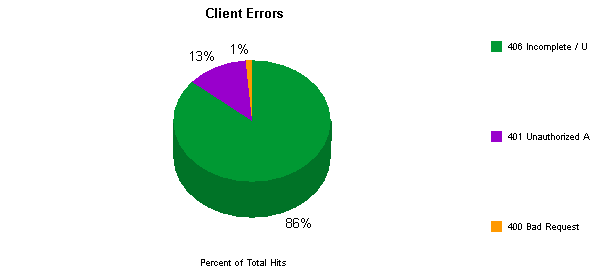
This section identifies the error codes from the browsers accessing your server. The table lists all the errors that occurred in order of number of failed hits. Tip: To focus your report, consider using the Return Code Filter for including or excluding return code data.
This is helpful for identifying the errors the client browser received and determining what maintenance is necessary.
This section identifies by type the errors that occurred on the server. The table lists the errors in decreasing order of the number of failed hits. Tip: To focus your report, consider using the Return Code filter for including or excluding return code data.
This is helpful for specifically identifying the server maintenance that can improve your site.